I was a late arrival to Seinfeld fandom.
Though the first episode was aired in the US in 1989, there would be a four-year delay until it was broadcast in the UK. As a teenager, and with the show lurking in the shadows of BBC’s late-night schedules, it passed me by.
It wasn't until the 2010s when Seinfeld reappeared on UK TV in a prime-time slot. Fully aware of the show's standing in the canon of popular culture this was my best opportunity to tune in.
1989
Seinfeld first aired on NBC in the USA
1993
Seinfeld first aired on BBC2 in the UK
2012
Seinfeld returns to UK prime-time on Sky TV
S4E4 - The Wallet
It only took a handful of episodes for me to find myself completely hooked. Seinfeld was written in a different key, deviating from the traditional rules of sitcoms, focusing on - and amplifying - the minutiae of daily life, earning its reputation as the show about nothing.
S4E3 - The Pitch
S8E3 - The Bizzaro Jerry
I loved the irreverent characters, with their absurd obsessions and neurotic tendencies, and the hilariously avoidable situations they found themselves in.
It rejected the classic three-act story, sidestepping sentimentality and the pursuit of resolution. With its mantra of no hugging*, no learning the lead characters were insecure and entertainingly flawed, lacking any desire and capability for personal growth.
*the earlier clip notwithstanding!
S9E24 - The Good Samaritan Law
As with any shows from its time, as culture and society evolve a contemporary lens exposes negative stereotypes and flashes of chauvinism and sizeism, to name but two isms. The amoral instincts of these anti-heroes was most on-show in their romantic encounters and when faced with the slightest adversity or irrational annoyance.
S3E9 - The Nose Job
And then there’s the dancing.
S8E4 - The Little Kicks
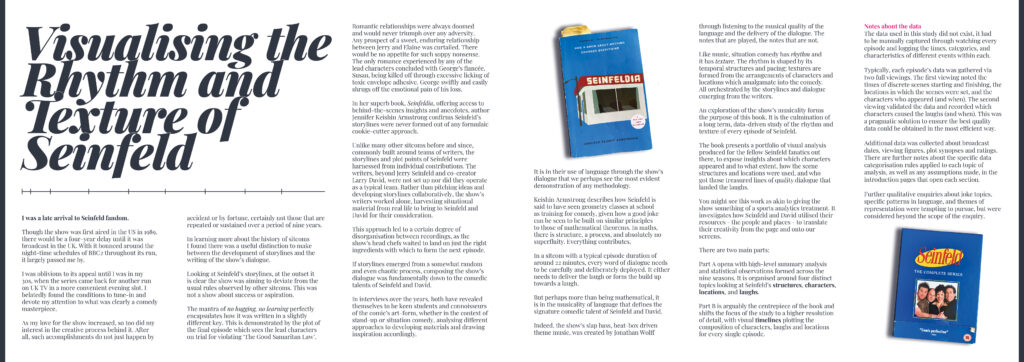
As I progressed through the episodes my fascination with the creative process behind the show grew. It was the musicality of the writing and its delivery that I particularly loved, orchestrated by the comedic talents of co-creators Jerry Seinfeld and Larry David.
Like music, situation comedy has rhythm and it has texture: rhythm is shaped by a show’s timing, its scene-structures, and its pacing; textures are created by the ‘instruments’ of characters and their locations, which amalgamate to create the situations from which the comedy manifests.
S5E4 - The Sniffing Accountant
S8E12 - The Money
S1E4 - Male Unbonding
S3E2 - The Truth
S7E21 - The Wait Out
My curiosity transcended just reading more about the show, it was now time to go deep. I decided to immerse myself in an entirely unnecessary, self-motivated, long-running, data-driven exploration of every episode of Seinfeld. Why not!
The first product of this work was my 2020 publishing of The Seinfeld Chronicles, a limited-edition printed book presenting all my extensive analysis. With 176 copies released, matching the number of written episodes, this reached a small but exclusive - and passionate - audience. In 2024 I decided it was time to work on a new product, to reach a wider audience with a completely new format: The Seinfeld Chronicles digital edition.

The Seinfield Chronicles
An unnecessary data exploration by Andy Kirk  ...
...
...unleashed in digital form by Anne-Marie Dufour , and Loud Numbers
... ...unleashed in digital form by Anne-Marie Dufour
, and Loud Numbers s1
1989-90
s2
1990-91
s3
1991-92
s4
1992-93
s5
1993-94
s6
1994-95
s7
1995-96
s8
1996-97
s9
1997-98
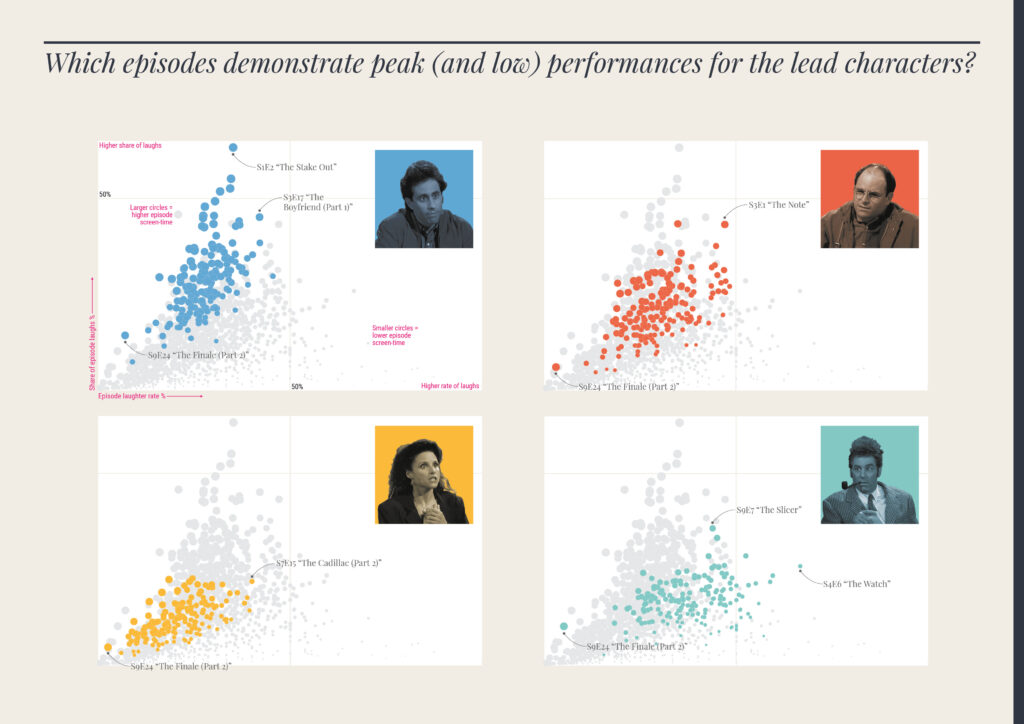
- Sagman, Bennet, Robbins, Oppenheim and Taft s1e2 The Stakeout, Jerry
- • Why do I need two bedrooms? I got enough trouble maintaining activity in one s1e3 The Robbery, Jerry
- • I think Superman probably has a very good sense of humor s1e5 The Stock Tip, Jerry
- • Master of the house doling out the charm, ready with a handshake and an open palm s2e2 The Jacket, George
- • I hate anyone that ever had a pony when they were growing up s2e3 The Pony Remark, Jerry
- • I'm an eggplant! I'm an eggplant! I'm a minstrel man! s2e8 The Heart Attack, George
- • You're as pretty as any of them, you just need a nose job s3e9 The Nose Job, Kramer
- • Boy, these pretzels are making me thirsty s3e11 The Alternate Side, Kramer
- • Tim, who's the head of the Aryan Union, you or me? s3e19 The Limo, George
- • I went in with a pretty woman? You know, kinda short, big wall o' hair, face like a frying pan? s4e14 The Movie, George
- • I'm disturbed, I'm depressed, I'm inadequate, I've got it all! s4e15 The Visa, George
- • God would never let me be successful; he'd kill me first s4e23 The Pilot (Part 1), George
- • She's not a novelty act, George. Where you hire her out for weddings and bar mitzvas s5e6 The Lip Reader, Jerry
- • I want you to have this job. Of course, sodomy is a pre-requisite s5e8 The Barber, Jerry
- • Did the medical journal say anything about standing in a pool of someone else's urine? s5e17 The Wife, Jerry
- • That sex will melt your face s6e6 The Gymnast, Kramer
- • Maybe he's just very well... red? s6e10 The Race, George
- • I wanna be a pirate s6e13 The Scofflaw, Kramer
- • You know, one of these days, something terrible is gonna happen to you. It has to! s7e11 The Rye, Elaine
- • I'm sitting there in a tepid pool of my own filth. s7e16 The Shower Head, Kramer
- • Beautiful women. You know they could get away with murder. You never she any of them lift anything over three pounds s7e20 The Calzone, George
- • I can still hear the retching, the screaming. I sent sixteen of my own men to the latrines that night. They were just boys s8e6 The Fatigues, Frank
- • If this board is so impressed with suffering, maybe you should tell them the Astonishing Tales of Costanza s8e10 The Andrea Doria, Jerry
- • Now, just because Jerry Seinfeld is a has-been, don't make Little Jerry Seinfeld a never-was! s8e11 The Little Jerry, Kramer
- • Well, I got gonorrhea s9e16 The Burning, Kramer
- • To the Idiotmobile! s9e17 The Bookstore, Jerry
- • Well, there's nothin' more sophisticated than diddlin' the maid and then chewin' some gum s9e19 The Maid, Elaine
Methodology
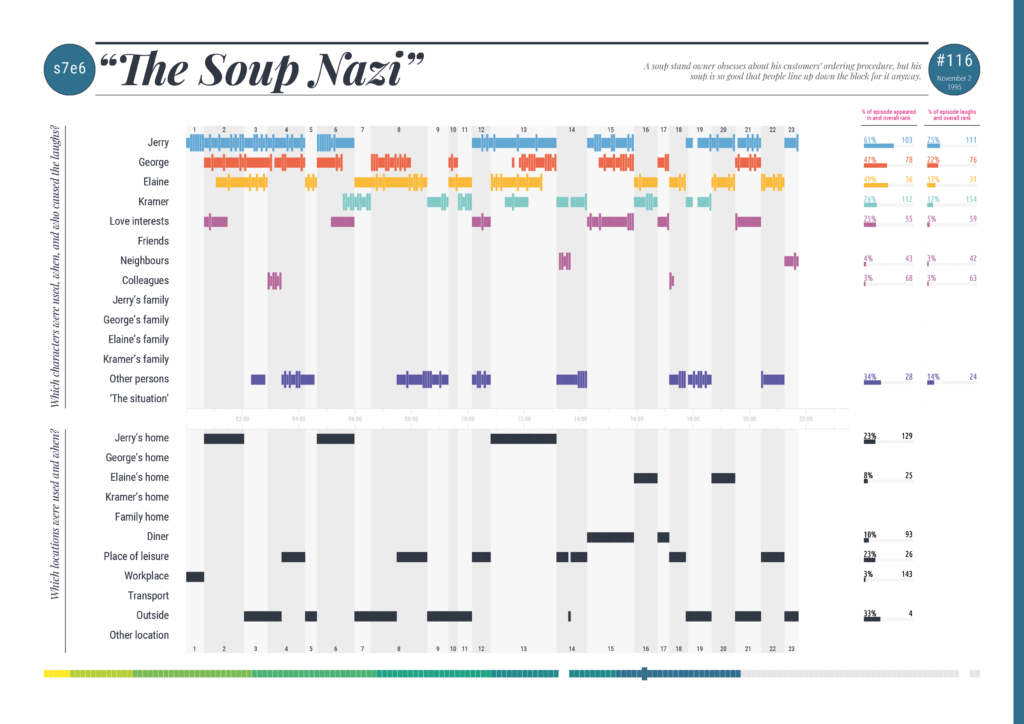
The data used in this study did not exist; it had to be manually captured by watching every episode and logging the times, categories, and characteristics of different events within each.
Typically, each episode's data was gathered via two full viewings. The first viewing noted the times of discrete scenes starting and finishing, the locations in which the scenes were set, and the characters who appeared (and when). The second viewing validated the data and recorded which characters caused the laughs (and when). This was a pragmatic solution to ensure the best quality data could be obtained in the most efficient way.
To help with the efficiency of the data collecting, all periods of screen time were recorded in units of 5-second durations. This felt like a sufficient granularity of detail to accurately quantify any character's appearance (and aligned with the typical length of time recorded for the duration of a laugh). To qualify as a period of screen time, a character did not necessarily need to be speaking or even interacting, just that they at least played some role in the storyline's progression.
Additional data was collected about broadcast dates, viewing figures, plot synopses and ratings via IMDb. Further qualitative enquiries about joke topics, specific patterns in language, and themes of representation were tempting to pursue but were considered beyond the scope of the enquiry.
Credits
Andy Kirk
Ideation, Data Analysis, Data Visualisation & Original Design
Anne-Marie Dufour
Data Visualisation, Digital Design & Development
Loud Numbers
Sonification
Mark Knott
Illustrations
Rob Barker
Data Collection & Research